
To start off this post, it’s probably fitting to quote a Duran Duran song (1990): “The lasting first impression is what you’re looking for.”
Besides starting with the usual housekeeping on the first day of class, why not set the tone for the course by providing students with a glimpse into the classroom environment as a community of learners, get students to connect with one another, AND do statistics? Look no further than an Icebreaker activity! We present two Icebreakers that can get your class (either in-person or online) off to a great start: Questions on the Back (a classic) and How Old? Visualization.
Questions on the Back Activity (Laura Le)
The purpose of the Questions on the Back activity is to allow students to experience statistics in an informal (and fun!) way. And, it can be implemented within in-person (note: does not adhere to the physical distancing guidelines) and online (asynchronous) introductory statistics courses.
Activity for in-person courses
The start of the activity is to tape a question1 to the back of each student. Students will not know the questions that are being taped on their back, but tell them that the goal of this activity is to collect data (numbers only!) from their fellow classmates to help them figure out what the question is on their back. Now, some of the questions may be easier to figure out, such as “What is your shoe size?”, and other questions may be harder to identify, such as “What is your lucky number?”.
1Instructor prep prior to class: (1) Create a list of questions where the answer is a number. Here is my running list as a starting point. (2) Print off the list and cut out the questions into little strips of paper. (3) Bring the strips and Scotch tape to class for the activity. (4) Create a slide (or a poster) of the activity’s instructions that can be displayed. Here is my slide for the instructions.
Note: For the remainder of this article, I’m going to refer to the students with the unknown questions on their back as Question Carriers and the students who read the questions and provide an answer as Responders.
At this point, students are asked to walk around the classroom with a writing utensil and something to write on and interact with their classmates. When a student finds a peer, I ask that they introduce themselves and possibly state their program or major. Then, the pair takes turns reading the question on the back of their peer in their head (silently) and providing an answer to the question with only a number and nothing else (e.g., no units). If the question asks “What is your…?”, it is a question about the Responder (and not about the Question Carrier). After collecting responses from all the students in the class (if the class size is less than 20) or after 15 responses (if the class size is greater than 20), students are to find a place at the board (if there is enough room) or use a drawing tool (paper, iPad) and graph the data to help them figure out what question was on their back.
Once everyone has graphed their data, I ask for volunteers to summarize their results (using the graph as a visual) and to try to guess their question. For those that volunteer, they are the first to be able to see their question on the back. The number of volunteers I have depends on how many minutes are left before class is over. In total, this activity takes approximately 20-30 minutes of class (or longer, depending on how many students you ask to describe their graph and guess their question).
This activity is one of my favorites to kick off the first day of my in-person introductory statistics courses. Why, you may ask?
- Speed Meeting: The activity allows students to meet and interact with their peers on a one-to-one basis in a less intimidating, more personal setting than in a large group setting (e.g., going around the room), and they can meet most of their peers (if not all of their peers) in a relatively short period of time. It’s a great way to set the class’s tone as a community of learners.
- Element of Surprise: The students are interested and motivated in figuring out what the question is on their back.
- DOING Statistics on Day 1: They are DOING statistics on the first day of class. They are collecting, and possibly organizing, real data, which is a GAISE recommendation and goal for introductory statistics courses. Some are using external cues (variables) beyond the number provided to help figure out their question, such as how long it takes Responders to answer the question or the Responder’s body language. hey are also summarizing data with a graph of their choice, since they are not told what kind of graph to create.
- Informal Assessment: The kinds of plots that are created help me, as the instructor, understand where my students are at in their prior knowledge (specifically, on graphical representations). I have seen all kinds of plots, some more useful than others, from boxplots and histograms to line charts (with the index number on the x-axis and value on the y-axis) and pie charts.
Activity for online courses
The online version has a similar goal of exploring real data while getting to know other students in the class, but the roles are flipped. Rather than one student trying to guess one question, one student gets a question, collects data on that question from information in their peers’ introduction posts2, summarizes the data with a plot, and creates a one- to two-sentence description of the data (but not the question) to the rest of the class in a Q&A forum. Then, their classmates respond to the post by guessing which question they had from the description of the data. Students are provided a Word document for the Icebreaker activity that includes the instructions for how to complete it.
2In the Introduce Yourself discussion forum, students are asked to answer five questions (all have numerical answers) about themselves and told that information will be used in a learning activity for that week. Then these questions are placed into the activity and students are “randomly” assigned to one question.
Since there are only a few questions (approximately five) that are asked of students, the questions will have multiple students supplying a description of the data. However, it is still very insightful to see how each student decides to tell the story of their data.
___________________________________
Note: I first learned about the Questions on the Back activity from Michelle Everson when I was a graduate student in the Statistics Education department at the University of Minnesota. To be honest, when I initially learned about these “first day” activities as a kick-off to the course, I was not 100% on board. I thought they sounded interesting, they might be fun, but they were a little cheesy (and not just because I’m from Wisconsin). This was before I tried it out in class, thus not realizing its potential for students and for instructors. So give it a go!)
How Old? Visualization Activity (Steve Foti)
This activity was inspired by a conversation I had with Dennis Pearl at USCOTS 2019 about fun things to try in the classroom. He was showing me a website that will try to guess your age from a picture that you take or upload and describing how he has used it before in the classroom. With a brand new data visualization course coming up in the spring semester, I was especially open to ideas that could be adapted to my course. After playing around with the website and reflecting on our conversation, I developed an activity and piloted it in two different courses, Biostatistical Literacy in the fall and Data Visualization in the Health Sciences in the spring.
The Biostatistical Literacy course is a graduate level service course that typically contains between 20-30 students, most of whom are advanced-degree-seeking medical professionals. The data visualization course is a new MS elective offered by our department that is open to both majors and non-majors, and most recently contained a small handful of students studying biostatistics as well as other health professions. These are the courses I have tried this activity in so far, but I believe it could be used in classrooms of any skill level.
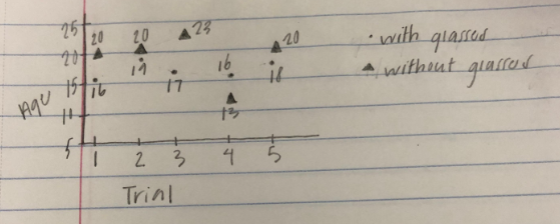
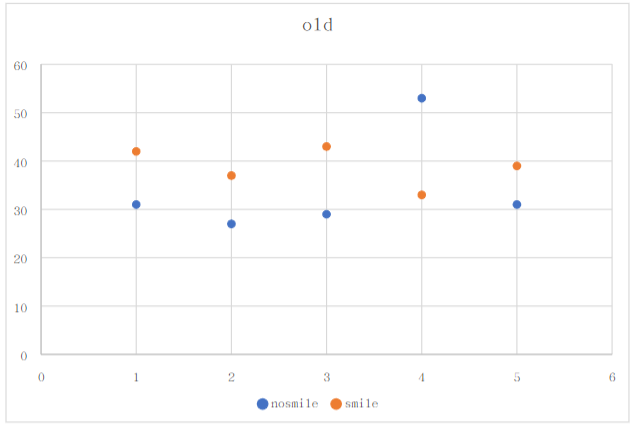
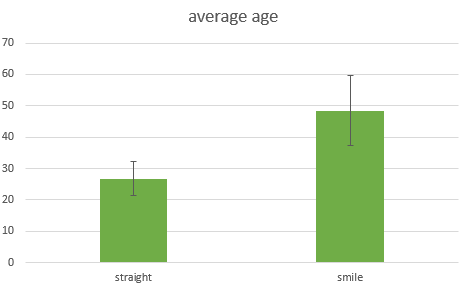
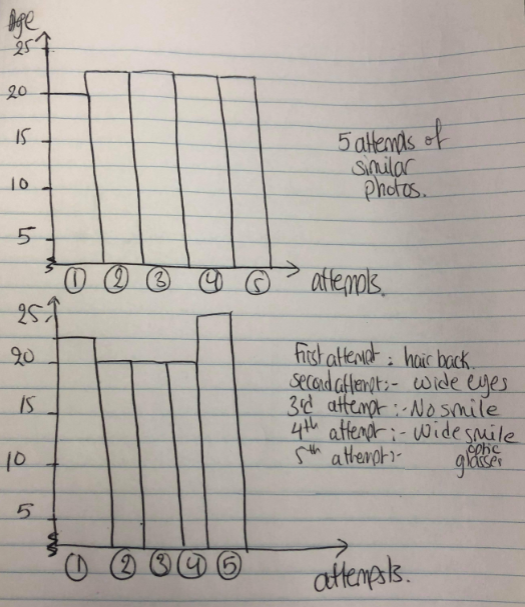
The basic idea of the activity is to collect data by having each student take multiple selfies (the website utilizes your default camera app) and record the age it guesses each time. With their individual data, students are asked to create a visualization to show some important feature of their data using any means they are comfortable with (e.g. pens, colored pencils, Excel, R). Then, in pairs or small groups, they are asked to think about and discuss ways they might be able to successfully manipulate the algorithm (e.g. putting on/taking off glasses, smiling, changing the angle). Using their idea, students collect more data and add it to their visualization in a way that distinguishes it from the original data. Finally, the data displays are shared with the class and we have brief discussions about them. I typically lead these discussions with questions like, what does this graph show? Does anything about the data stand out to you? Does it look like the attempt to manipulate the algorithm was successful?
The full activity instructions are shared on our resources page.
I enjoy this activity because it is a little bit different than your standard icebreaker. The discussion between students has an element of fun and mystery, and is likely something that they have not worked with before. At the same time, the work they are completing allows them to showcase their creativity and their comfort with graphing and communicating about data. Below are a couple of examples that students in my classes have created through this activity. Not all of them exactly follow the instructions, but are still generally on topic and are interesting to see.
So far, I have only tried this activity twice in a face-to-face setting. This fall, I will be testing it out in an asynchronous, online version of the biostatistical literacy course. Since we can no longer have a live discussion, I have changed the activity submission to a discussion board format. Students will upload their final graphic and post their conclusions about their data, their graphic, or the algorithm used by the age guessing software. I may also require them to respond to at least one post in an attempt to encourage interaction and full participation in the activity.
I think this activity lends itself a little better to the face-to-face setting. Here, students are able to interact throughout the process and share their thoughts on how they might manipulate the algorithm. It is more fun, in my opinion, when students can share and laugh about the results of the age guesser, compare ideas for manipulating the algorithm, and be present for the concluding discussion. In the online setting, the students are no longer able to have the same level of interaction, so while the activity still offers some benefit as a statistical activity, it loses some of its credibility as an icebreaker.

Leave a comment