Many colleges and universities have made a strong effort to make their campuses more inclusive to all people, especially those from underrepresented and historically marginalized minority groups. These efforts include faculty incorporating instruction that focuses on Diversity, Equity, and Inclusion (DEI) issues in their classroom. Statistics instructors have a unique opportunity to engage students in work around DEI considering there is an abundance of data available today to explore these issues. In this blog post, we share some of the data sets and activities we have used in our undergraduate introductory statistics classes to engage students in conversations around big issues that persist in marginalized groups.
“Research has shown that diverse groups are more effective at problem solving than homogeneous groups, and policies that promote diversity and inclusion will enhance our ability to draw from the broadest possible pool of talent, solve our toughest challenges, maximize employee engagement and innovation, and lead by example by setting a high standard for providing access to opportunity to all segments of our society.”
President Obama, October 5, 2016
These conversations can be hard and uncomfortable, but we believe it is up to us as faculty members to help students grapple with these concepts in a safe space while they become statistically literate consumers of data. Elon University prides itself on engaged learning. Therefore, class activities often begin with a whole class discussion to launch the task, followed by students working independently by themselves or in small groups on relevant data investigations. Although some direct instruction is necessary, each activity presented below often takes the majority of class time. While the instructor walks around the room answering questions and checking on student progress, often students are seen helping each other as well.
Fatal Encounters
A class assignment or project using data from the Fatal Encounters website1 is a useful way to help students think about issues of race in police-involved deaths. This website has a downloadable database that documents non-police deaths that occurred when police were present. Data is available from January 1, 2020 to the present day. Variables available in the data include name, age, race, gender, date, location, and cause of death. There is also a variable with a link to an online source, such as a news article, that describes each incident. Students begin the lesson by examining several observations in the data set, and reading the associated online article(s) that discuss the incidences. This helps students realize that there is a story and a person behind each observation.
As part of an assignment, students examine the proportion of police-involved deaths that involve Black individuals, White individuals, and individuals of other races. By comparing these proportions to the proportion of the population that are in different race groups, students see trends. For example, the proportion of Black individuals that are involved in Fatal Encounters with the police is much higher than the proportion of Black individuals in the population.
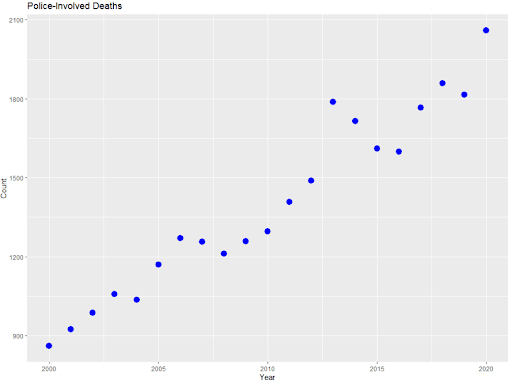
Using software, students can find the total number of documented police-involved deaths by year. Generating a scatterplot of total deaths versus year shows an increasing trend, which can be seen in Figure 1. A discussion on this trend can include questions about whether students think the actual number of police-involved deaths is increasing over time and/or whether they are just being documented more than they had been in the past.

After discussing the overall trend and possible reasons for the increase in the number of police-involved deaths over time, it could be beneficial to wrap up the Fatal Encounters assignment by showing a video. An example of a video that is related to this topic is an interview of Bryan Stevenson, founder of the Equal Justice Initiative, speaking about steps that may help move the country away from racially biased policing. Another way to conclude the activity would be to explore the Fatal Encounters Data Visualizations website2. At this link, students can work with an interactive Tableau data visualization and examine police-involved deaths by year, state, and race.
Marijuana Usage
In 2018 the American Civil Liberties Union (ACLU) released a research report titled A Tale of Two Countries: Racially Targeted Arrests in the Era of Marijuana Reform3. This report details marijuana arrest rates between 2010 and 2018, during a time when many states were either legalizing recreational marijuana use or lessening the severity of punishments for marijuana arrests. Despite this movement, the ACLU found that Black individuals are still 3.6 times more likely than White individuals to be arrested on charges related to marijuana possession.
Based on the findings summarized in the article, the ACLU released an interactive website where people can investigate the marijuana arrest rates between Black and White individuals in their own states and even their counties (the findings focus on just individuals who identify as Black or White). As an introduction to hypothesis testing (using an informal inference approach), an activity investigating statistics specific to a county can be created, such as the one where our campus of Elon is located. As of 2018, the marijuana arrest rate for Black individuals was 4.7 times that of White individuals in our campus’s county. The ACLU has found that though arrest rates are higher for Black individuals, marijuana usage is consistently the same across the two races. Thus, all things being equal, if people were randomly arrested, shouldn’t the percentage of Black individuals arrested be proportional to the percentage of Black individuals in the county? Students carry out a simulation to investigate if there is evidence against this claim, based on the data (see Figure 2).
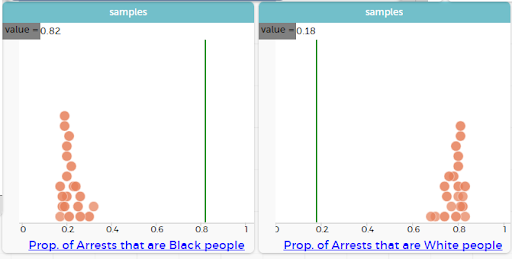
A CODAP sampler4 or other types of similar applications can simulate sample proportions of White and Black individuals arrested in specific counties. The dots here (see Figure 2) represent the expected proportion of each race that would be arrested based on random samples of individuals if each race was equally likely to be arrested. For each race group, the green line represents the actual proportion of arrests in the county (i.e. 82% of all marijuana arrests in our county were of Black individuals). Students can clearly see that the green line is very unlikely to happen due to chance. This example is referred to again when the concept of p-values is discussed in hypothesis testing.
Student-Led Discussion
Student-led discussions can be a great way for students to learn about DEI-related issues from their classmates. This assignment aligns to Elon’s Core Curriculum communication goal of preparation and presentation of ideas information orally, visually and in writing. The student-led discussions are intended to be a way for students to launch data investigations, so they often take place at the beginning of class. Groups of 3-4 students present a 15-20 minute lesson to the class based on an article assigned by the instructor that has a DEI focus. For example, one group examined an online article5 about how the prevalence of pregnancy-related deaths of Black mothers is higher than White mothers. Another group presented on an online article6 about the effects of poverty on children’s brains.
Each group summarizes the article, explores statistics that are featured in the article, and provides questions for small-group or entire class discussions. Groups are also instructed to look up additional information and data related to the topic. Most student groups utilize competitive online quizzes, such as Kahoot during their lesson to help their classmates stay engaged, but other technology options, such as Socrative, Jamboard, or Mentimeter, are also encouraged. This type of activity works best when all students in the class (not just the discussion leaders) read the article before coming to class.
Future Research
We are currently surveying faculty who teach introductory statistics at the college-level to investigate their efforts in promoting DEI related issues in their coursework. We are investigating whether instructors think it is important to include elements of DEI in their coursework. We are interested in what and how instructors are teaching, and if current practices include elements of DEI. We also want to research opportunities and constraints that may support or hinder instructors from infusing DEI into the curriculum. We anticipate that the results of the survey will support our hope that instructors want to implement such activities in their classes, though the resources available are limited. The next step in our project is to create a repository of open educational resources that faculty can use to incorporate DEI into their introductory statistics classrooms.
If you teach introductory statistics for undergraduate students (regardless of whether or not you have implemented tasks around DEI issues in your own courses), please consider taking our survey (approximately 15 – 20 minutes of your time). For every 100 respondents, we hold a random drawing for a $50 Amazon gift card.
Link to take the survey: http://elon.co1.qualtrics.com/jfe/form/SV_e9VOrBv1iPcXK3c
Within Elon University’s 10 year strategic plan, Boldly Elon7, one of the themes is Thrive. Within this theme there is this objective “advance inclusive classrooms and pedagogies through research and faculty development”. To advance this objective, faculty are supported and encouraged to try new pedagogies, especially those that support diversity, equity, and inclusion. We recognize that all faculty may not feel supported to try to incorporate this pedagogy because of student or institutional pushback. Dr. Brene Brown, a research professor at the University of Houston, says “People are opting out of very difficult conversations about DEI because they’re afraid of being wrong, looking wrong, saying something wrong.” Dr. Brown goes on to explain that this is not an excuse to not have these challenging discussions. We hope you can find the space to have these conversations in your classrooms.
Contributing author Heather Barker is a lecturer of Mathematics and Statistics in the Department of Mathematics and Statistics. She teaches statistics courses as well as courses for mathematics education students. Her research interests lie in statistics education, text mining, and diversity/equity/inclusion pedagogy.
Contributing author Kirsten Doehler is an Associate Professor of Statistics in the Department of Mathematics and Statistics at Elon University. Her research interests include statistics education, survival analysis, and diversity/equity/inclusion. For more information, visit her faculty page.

Footnotes
1Fatal Encounters. (n.d.). Retrieved October 13, 2021, from https://fatalencounters.org/.
2Fatal Encounters: Our Visualizations. (2021, January 3). Retrieved November 2, 202, from https://fatalencounters.org/our-visualizations/
3A tale of two countries: Racially targeted arrests in the era of marijuana reform. American Civil Liberties Union. (2020, April 20). Retrieved October 13, 2021, from https://www.aclu.org/report/tale-two-countries-racially-targeted-arrests-era-marijuana-reform.
4Barker, H. (n.d.) Racial Disparities in Marijuana Arrests in 2018 CODAP document, https://tinyurl.com/6d4v9rt5
5Williams, A. E., Kindelan, K., & Hodgson, K. (2020, July 10). 26-year-old Black Woman’s death during childbirth leads to calls for change. Good Morning America. Retrieved October 13, 2021, from https://www.goodmorningamerica.com/wellness/story/calls-change-26-year-black-woman-dies-childbirth-71698417.
6Katsnelson, A. (2021, April 7). A novel effort to see how Poverty Affects Young Brains. The New York Times. Retrieved October 13, 2021, from https://www.nytimes.com/2021/04/07/upshot/stimulus-children-poverty-brain.html.
7https://www.elon.edu/u/administration/president/boldly-elon/thrive/

Leave a comment