
The theme of this year’s United States Conference on Teaching Statistics (USCOTS) 2019, “Evaluating Evidence,” put an emphasis on the current discussion/debate on p-values and the use of the word “significant” when making statistical conclusions. Conference-wide presentations (1, 2, 3) offered updates to the ASA official statements on p-value based on the special issue of The American Statistician and potential ways to move beyond significance.
Now that USCOTS is four months behind us, we thought it would be a good idea to reflect on how it has impacted each of our teaching plans for this year. Each member of our editing team has shared their thoughts below. What are yours? [Share your plans in the comments section.]
If you are interested in starting a discussion about “statistical significance” in your own classroom, check out this cooperative learning activity that Laura Ziegler used in her department.
Impact on Steve’s teaching:
I left USCOTS feeling cautiously optimistic about the p-value/significance debate. On one hand, I was starting to feel like the discussion was spinning its wheels, focusing only on defining the problem and not on coming up with solutions. On the other hand, I learned about new ideas from numerous presenters that not only focused on alternative ways of evaluating evidence, but also on how to teach these new methods in the classroom. Despite my mixed feelings, the front running solution in my mind is covered in The American Statistician editorial: results blind science publishing (Locascio, 2017; 2019). Not only does results blind publishing mean that studies will be evaluated on the importance of their research questions and appropriateness of their study designs, but it will simultaneously remove limitations inherent to p-values and other similar measures that result in intentional (or unintentional) misuses of statistics. I think journals that implement this review strategy will be making a big step in the right direction.
In the classroom this semester, I want to actively reduce the emphasis on p-values and statistical significance to make sure my students are grasping the bigger picture in statistical problem-solving. I think instructors of statistics tend to overemphasize the results of models, which causes students to make quick, straightforward conclusions using p-values. In an attempt to remedy this, I will be making a more conscious effort to prioritize the overarching statistical process during class and on homework feedback.
Impact on Laura Le’s teaching:
After USCOTS, I brought the conversation back to my teaching team in Biostatistics. There were a few courses that were being revised and so it was a perfect time to discuss what to do about this phrase. We decided to continue using the phrase “statistical significance” in the introductory biostatistics courses, because it is a phrase our students will frequently encounter in the medical and public health literature. Instead, we decided to add some discussions and/or material about what this phrase does and does not mean. For example, in the online course that I redesigned, I incorporated possible implications when a result is or is not statistically significant.
Impact on Laura Ziegler’s teaching:
I attended USCOTS with three colleagues interested in statistics education. As a group, we decided that changes needed to be made with regards to how we teach hypothesis tests at our university. We have many flavors of introductory statistics in our Statistics department, nine to be exact! All instructors have their own methods of teaching, but we decided as a group that we wanted to be unified on how we approach significance. We held multiple meetings open to anyone (faculty or students) to discuss our plans. Participants included people who love p-values to those who did not necessarily think that they needed to be taught in an introductory statistics course. In our first meeting, we participated in an Academic Controversy cooperative activity to start the conversation about p-values. Approximately 50 faculty and students, including statisticians and non-statisticians, attended.
In our next meetings, we all agreed there is a larger conversation to be had about statistical significance, but we decided on the following changes that could be easily implemented this semester in the short term.
- Put more effort into teaching practical significance.
- Avoid teaching hypothesis tests as a stand-alone statistical method. Emphasize other analysis and discussions should occur along with hypothesis tests such as effect sizes or confidence intervals.
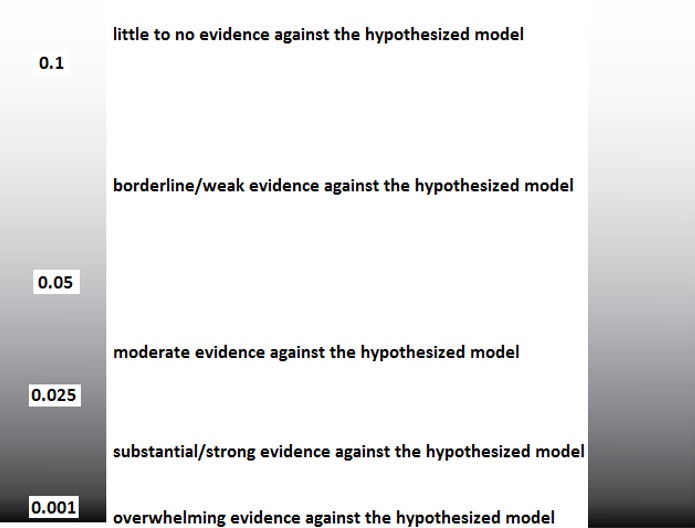
- Use a grey scale for significance. We adapted a scale from the CATALST project with a minor change, adding grey!
I personally love these changes, and look forward to hearing more discussions and suggestions on the topic.
Impact on Adam’s teaching:
Since I started teaching introductory statistics as a graduate student, I have taught hypothesis testing via the interpretation of p-values using the sliding scale Laura Z. outlined above, while mentioning the dogmatic p < 0.05 and “ranting” against its use. So why teach the dogmatic interpretation? Well… I usually tell myself it’s because students will see that usage outside of my course and that I am making students statistically-literate citizens… but upon further reflection, that’s simply a justification for writing problems that are easier to grade. Since USCOTS I made a resolution: I will still teach how to interpret a p-value as strength of evidence, but I will not lean on them to help students make overly-simplistic statements about that evidence. Yes, some test questions will be harder to grade, but having students express what evidence actually is/means will be powerful. Further, I will continue to recommend the use of confidence intervals, where possible, as students can see borderline situations—e.g. does the interval (0.001, 0.067) support a meaningful difference? Finally, I resolve to think about how to effectively discuss effect sizes in class. I admit that I am not familiar with how these are used across multiple disciplines, and I am leery of simplistic statements of what effect size is “big” or “interesting”, since these seem dangerously close to “significant”, but they do seem to be better tools. If you want to write a blog post on the topic, let us know!
Impact on Doug’s teaching:
I initially taught p-values with a narrow approach: alpha levels and dichotomous decisions. While I initially used a variety of alpha levels (more than just 0.05), there wasn’t much emphasis on when different alpha levels would be used – it was more procedurally focused. I then broadened my approach by considering different alpha levels for different contexts and emphasizing the relationship between alpha levels, Type I and II errors, and power. My next major teaching shift was to teach significance using the strength of evidence approach (as discussed by Laura Z. above). At my current institution, we emphasize the strength of evidence approach but also teach alpha levels for rejecting/failing to reject the null hypothesis. I present multiple ways to make a conclusion from p-values because it is plausible that students are going to encounter a variety of correct and incorrect uses of p-values after their introductory courses and preparing them as much as possible is key.
I have also started asking students a follow-up question after they have interpreted the p-value such as “If you were the company in the problem, would you choose to [discuss the different options here]…” Again, this is no panacea, but connecting the evidence back to a (hypothetical) real-world decision seems to make the idea of strength of evidence easier for students to grasp.
After the USCOTS keynote and ensuing discussions, my colleagues and I discussed where we wanted to go with this. We currently have plans for iteratively improving our introductory statistics courses over the next few years, and making changes with regard to p-values is on our list. We don’t know how we will be teaching evidence in a few years, but for now we are planning on having more common assignments that emphasize a variety of different ways of interpreting results. It’s a manageable first step toward something more.
Referenced USCOTS presentations:
- Opening Session (Beth Chance, Danny Kaplan, Jessica Utts)
- Keynote by Ron Wasserstein and Allen Schirm
- Keynote by Kari Lock Morgan

The comments by Steve, Laura Le, Laura Ziegler, Adam, and Doug present thoughtful ideas on how to improve treatment of p-values and significance tests in introductory statistics courses. However, there are a couple of other items I would like to point out as important to consider when discussing p-values and significance tests.
One is the dependence of significance tests on model assumptions. For more information and teaching ideas on this, see pp.20 – 27 at https://web.ma.utexas.edu/users/mks/CommonMistakes2016/WorkshopSlidesDayTwo2016_Part1.pdf
The other is Type M and Type S errors. For some discussion of these and related topics, see pp. 28 – 32 of https://web.ma.utexas.edu/users/mks/CommonMistakes2016/SSISlidesDayThree2016.pdf
Note: The two links above are from the website https://web.ma.utexas.edu/users/mks/CommonMistakes2016/commonmistakeshome2016.html, which may have other items of interest to followers of StatTLC
In one of my classes, we use the ISI textbook, where the first chapter has the word “significance” in the title — no postponing the issue! At first, we just used a strength of evidence approach with high expectations for the interpretations of the p-value. (I commiserate with Adam on the grading!) Then we got to power which relies on the idea of a significance level, so that’s when we had a class discussion (based on assigned readings) about the problems a bright red line can cause. A few faculty members in my department have been meeting regularly to discuss these issues, because we have a feeling questions are going to keep popping up all semester!
Hi all, thanks for sharing!
On top of communicating such messages to students, I think another important component of this initiative is to communicate these messages laterally to our colleagues in the domain disciplines as well: biology, econ, sociology, psychology, environmental sciences.
I say this is because IMO students who major in those fields will ultimately take their cues from faculty/instructors/staff in those departments, and not necessarily their intro stats profs. So while we can rant against “p-value < 0.05" as much we want, students really need to hear it from "management" as well.
It sounds like Laura Ziegler has started such an initiative to this effect by inviting both statisticians and non-statisticians to their Academic Controversy cooperative activity. 👍👍👍
Prof. Miles Ott and I have plans to give a Sigma Xi talk on this topic next spring. Sigma Xi talks are cross-disciplinary lunchtime talks of a more accessible nature, so we view this as an excellent opportunity to deliver the gospel to our colleagues in the sciences and engineering.
Bert,
I agree wholeheartedly. Another way of communicating these messages to colleagues and students in other disciplines is offer to participate in suitable seminars in those disciplines — especially ones where students read and report on research papers. (I did this for several years with a biology seminar.)
That’s great! It seems we both agree that we need both high-level top-down statements and think pieces, but also bottom-up grassroots “boots on the ground” approaches too!
I am very excited you have embarked upon this work! I look forward to reading stimulating posts for years to come.
One addition I want to make to your p-value post: while I have utilized strategies similar to your own (not out of coincidence), I also emphasize the historical origins of these methods. Specifically, I have my students engage in creating their own solution to the “Lady Tasting Tea” problem. Most students quickly notice that we need to eliminate the chances of passing a test via guessing. I then use this opportunity to introduce them to this passage from Chapter 12 of Fisher’s 1925 Statistical Methods for Research Workers:
The value for which P = .05, or 1 in 20, is 1.96 or nearly 2; it is convenient to take this point as a limit in judging whether a deviation is to be considered significant or not. Deviations exceeding twice the standard deviation are thus formally regarded as significant. Using this criterion, we should be led to follow up a false indication only once in 22 trials, even if the statistics were the only guide available. Small effects will still escape notice if the data are insufficiently numerous to bring them out, but no lowering of the standard of significance would meet this difficulty. (p. 45)
I specifically point out that Fisher described p=0.05 as convenient. In this I attempt to demystify the 0.05 threshold, which, I believe, in combination with the continuum of evidence method described in your post, helps students avoid dichotomized interpretation of p-values through a more robust understanding of how the threshold came into being.